Happenings, Updates, and Client FAQs

Crazy, Sexy Properties

Posts tagged market
Bureau of Labor Reports Rental Increase in Q2 2019
Screen Shot 2019-07-15 at 8.50.45 PM.png
 

Los Angeles, CA - Growth of rental rates between 2018 and 2019 shows no slow down despite a seasonal lull in the first quarter of 2019. US Bureau of Labor Statistics’ Consumer Price Index (CPI) for Los Angeles and Orange County shows the cost of rental of residences (Housing-Shelter-Owner’s equivalent rent of residences) increased year-over-year by 5.1% to 5.8% for April, May, and June in the two counties. The government has attributed this to strong job growth in the labor market.

In Los Angeles, overall CPI has only grown app 3.3% from June 2018 to June 2019. There were some numbers in the index that reduced through the quarter. Food prices decreased .3% from May 2019 to June 2019. The energy index decreased 4.1% and the bureau attributes this to lower prices of gasoline.

Lower vacancy, slow increase of supply, and the additional 1.19million jobs over the last decade have all attributed to the increases. Housing continues to account for the biggest share of household expenditures. Cost of home ownership has also increased higher at least 1% over the CPI.

 
2018 Ends with More Price Adjustments
 

Los Angeles, CA - Jeff L, our good friend and title agent at Fidelity National Title, updated us with some transaction numbers to confirm these last few months were the lowest transacted months since recovering from the recession over ten years ago.

We did start seeing signs after the first quarter of 2018. Especially in pockets that were contingent upon the sales of a main local market, we saw continuous price adjustments. Areas like Altadena or El Sereno, where buyers preferred Pasadena and were priced out, saw the biggest price adjustments. Through 2018, price adjustments of $75,000 on a $850,000 original asking price were not uncommon as homeowners found they had overestimated the value of their homes.

Condo and townhome appreciation also reversed its 2018 gains through this time. Though so many new construction in Los Angeles are the typical 3 story narrow lot developments in community subdivisions, detached single house number single family residences in tracts like these were a bit more resistant to the price normalization.

However, places that had continuous transportation development or great school districts were not as hampered by this. Builders of new construction have begun to increase incentives for buyers across Southern California.

So if you’ve been waiting on a slowdown to find a new home, 2019 is going to be a year with a lot less offers and more opportunities. Get qualified and Torcora will write your offer with you. Contact jason@torcora.com to start purchasing your property.

 
marketJanet Bangmarket
Even the Fixers are Overpriced
 
fixxer.jpeg

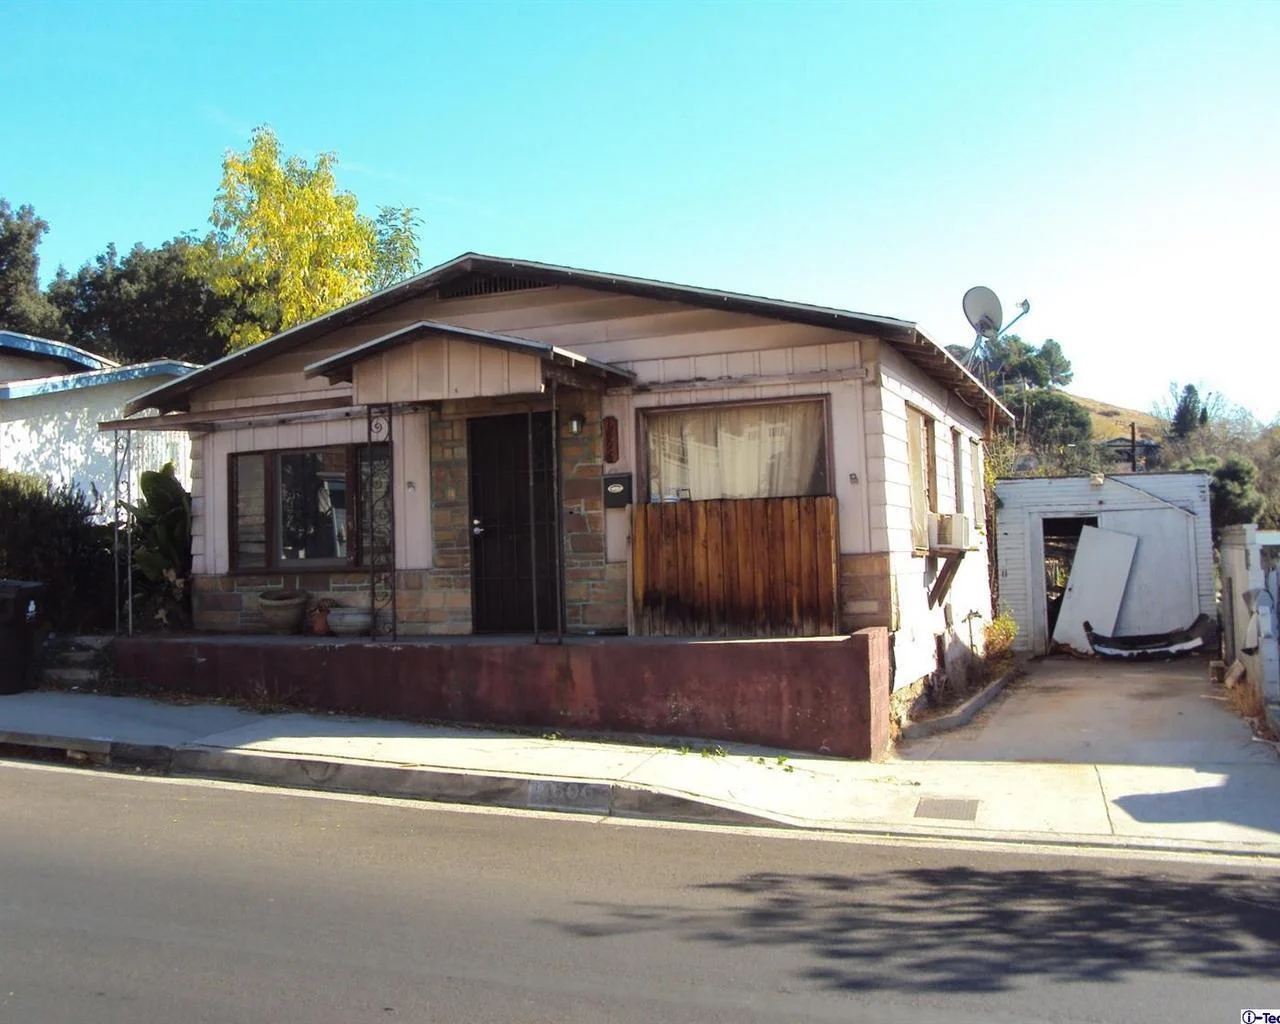
Los Angeles, California - Torcora has been taking steps to acquire not only rental properties but also under valued assets. As part of our adventure to find a “fixer,” we found them consistently over valued. In fact the asking prices have risen a solid 20% over the last 18 months in some of the pockets we are searching.

2019 One Year Update: Had we purchased a single unit residence of this type up to $1 million, our results would be negative.

“LA home prices are overvalued,” notes Elijah C from Curbed. Los Angeles has long been well known as a top 5 most expensive urban area to live in. However, many real estate data trackers report that sales prices are 10 precent above where long term trends suggests they should be. Especially when mapped against the salaries of typical buyers.

“Prices are just so darn high… proceed with caution,” says CoreLogic’s chief economist.

By some calculations, Los Angeles area homes have been overvalued since June of 2017, when sale prices in the region hit an all-time high. Many attribute it to the historically low interest rates. We do expect prices to plateau, hopefully soon, when interest rates rise to a rate that potential buyers are wary of high prices and when they are no longer getting a “deal” on their loans.

 
marketJanet Bangmarket
3 of Top 10 Most Expensive Counties are In Southern California
 

California continues to dominate the high end real estate market across the United States.

After analyzing the NAR (National Association of Realtors) Realtor Luxury Home Index, Los Angeles, Orange County and Santa Barbara are in the top 10 counties in the nation.

In Los Angeles the fall(September) 2016 sales price of the top 5% as defined by the luxury tier was $1.88 million, climbing from $1.83m the year before and 33% within 5 years from 2011. The increase in price in LA county has also been steady while the other two counties saw their 5 year lows in 2012.

In Orange County, the fall 2016 sales price of the top 5% topped $1.76m. The fall 2015 luxury tier sales topped $1.67m. Not to be outdone, in approximately 5 years, Orange County saw a growth of 38.5% growth in luxury home price from the 2012 low(March) of $1.27m.

Santa Barbara actually saw a high of $2.67m back in May of 2015. In September of 2016, this price has actually fallen about 11.6% to $2.36m. However, when compared to the 5 year low of $1.69m in 2012, Santa Barbara has in fact made the most significant gains of nearly $1m when comparing highs and lows between 2011-2016.

Other notable counties in Northern California - San Mateo, San Francisco - prices rose by 9% and 6.8%, respectively. Across the bay in Marin, prices fell by 7.1%. These three counties have indexed prices of $2.15m-$2.38m. Santa Clara’s prices closely Los Angeles at $1.83.

While Manhattan is king with $3.85m averages, Brooklyn was at $1.44m, Boston at $1.16m. Their growth rates since 2013 (the rebound of the economy) have been more than 40%, 30%, and 20%, respectively.

 
marketJanet Bangmarket
Interest Rates Hit Historic Lows since 1971
MIRS DEC 2012.png
 

Washington, D.C. - Federal Housing Finance Agency (FHFA) reported that the National Average Contract Mortgage Rate for the Purchase of Previously Occupied Homes by Combined Lenders was 3.36% based on loans closed in November. Using these numbers as an index in some adjustable-rate mortgage (ARM) contracts, this is a historic low. There was a decrease of 0.08 from the previous month. For more info on how FHFA collected this data please visit: www.fhfa.gov/DataTools/Downloads/Pages/Monthly-Interest-Rate-Data.aspx.

 
marketJanet Bangmarket